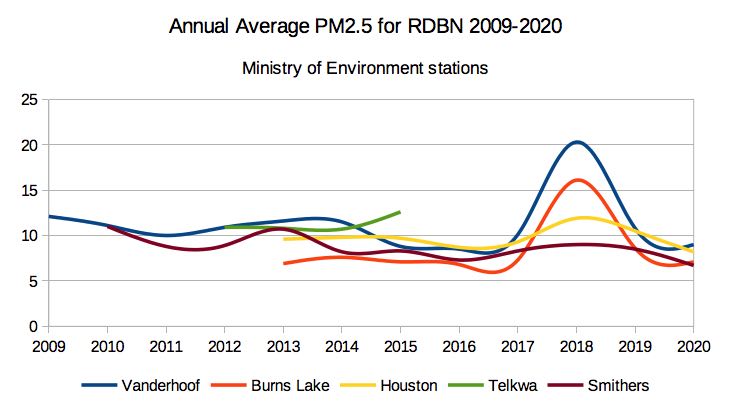
Charts for historical values of PM2.5 in the RDBN (Burns Lake)
1,516
This is a great report prepared by Dave Stevens on August 20, 21.

Highlights:
Data analysis and interpretation are not value-free actions.
The purpose of computation is insight, not numbers.
Assessing human health impacts on an annual average basis is a mistaken approach.
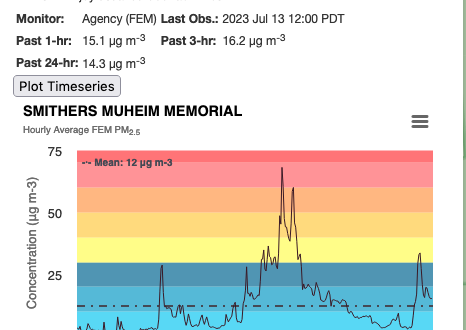
Adverse health effects are caused by extreme values, no-one can breathe an average.
The word standard is ambiguous. It may be either descriptive or prescriptive.


You May Also Like
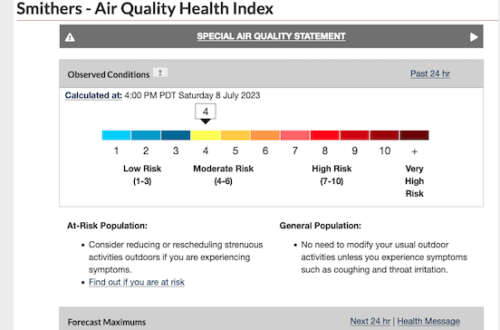
Health Services and Messaging
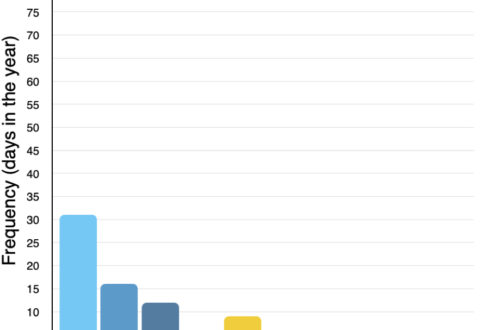
How much of last year were you exposed to poor air quality?